==================
A Caveat and Affiliates
First off, a little caveat: within my articles you will find affiliate links, meaning if you buy them, I get a small commission. Your cost is not affected. In addition, I am an Amazon Associate and I earn from qualifying purchases on Amazon.
And yes, if I say that I recommend a product here, it means I truly believe it is a good product. I refuse to recommend any product that I have not researched and believe to be a good value.
Even better, I provide you with a very clear picture of the product, it’s use, and the probable value.
Earning your trust is important to me. I run this website myself and the commissions and donations help support the site.
Sound reasonable and fair enough? Let’s continue to the article.
==================
Do you always wonder what the weather will be like? You can easily get those answers with the help of backyard weather station data visualization tools. This article will show you simple ways to turn weather data into clear pictures that tell you all about the weather in your backyard. Read on to find out how!
Weather enthusiasts and hobbyist meteorologists have always shown keen interest in monitoring and understanding the weather patterns right in their backyards. With advancements in technology, it’s become easier and more accessible to set up personal weather stations that can collect a variety of climatic data.
Using sophisticated data visualization tools, you can transform that raw data into insightful, easy-to-understand visual formats. These tools allow you to observe current conditions and spot trends and changes over time.
Bridging the gap between data collection and interpretation, visualization software takes the complexity out of weather analysis. By integrating with your personal weather station, these tools provide real-time updates and historical data perspectives that are pivotal for accurate weather predictions. Whether you aim to share your findings with a community of weather enthusiasts or use the data for your own interest, visualization tools help streamline the process—making complex datasets comprehensible and engaging.
Key Takeaways
- Personal weather stations provide detailed climatic data that can be visualized for better understanding.
- Visualization software turns complex weather data into accessible, real-time updates and trend analyses.
- These tools enhance the personal weather monitoring experience by simplifying data interpretation and sharing.
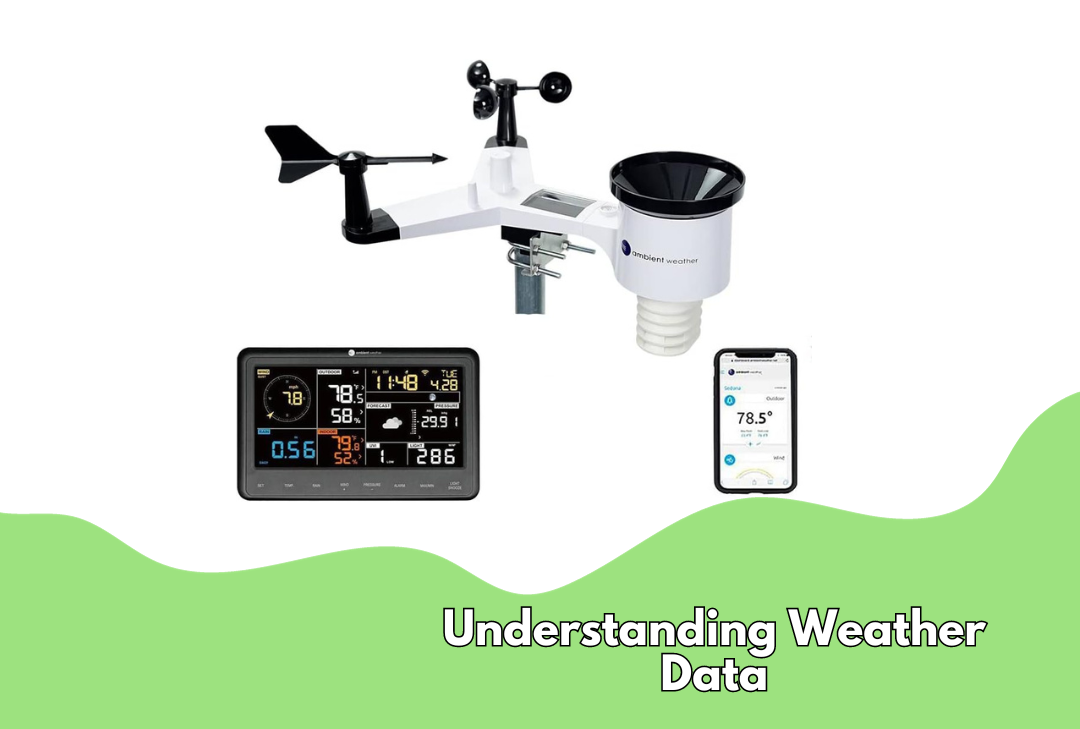
Understanding Weather Data
Gaining insights from weather data can transform how you perceive and respond to your outdoor environment. With the right information, you’re well-equipped to make informed decisions.
Types of Weather Data
Weather data encompasses a variety of metrics critical to understanding atmospheric conditions. Temperature, humidity, precipitation, and wind speed are fundamental data types you will encounter. Additionally, atmospheric pressure and solar radiation levels provide a deeper understanding of weather patterns.
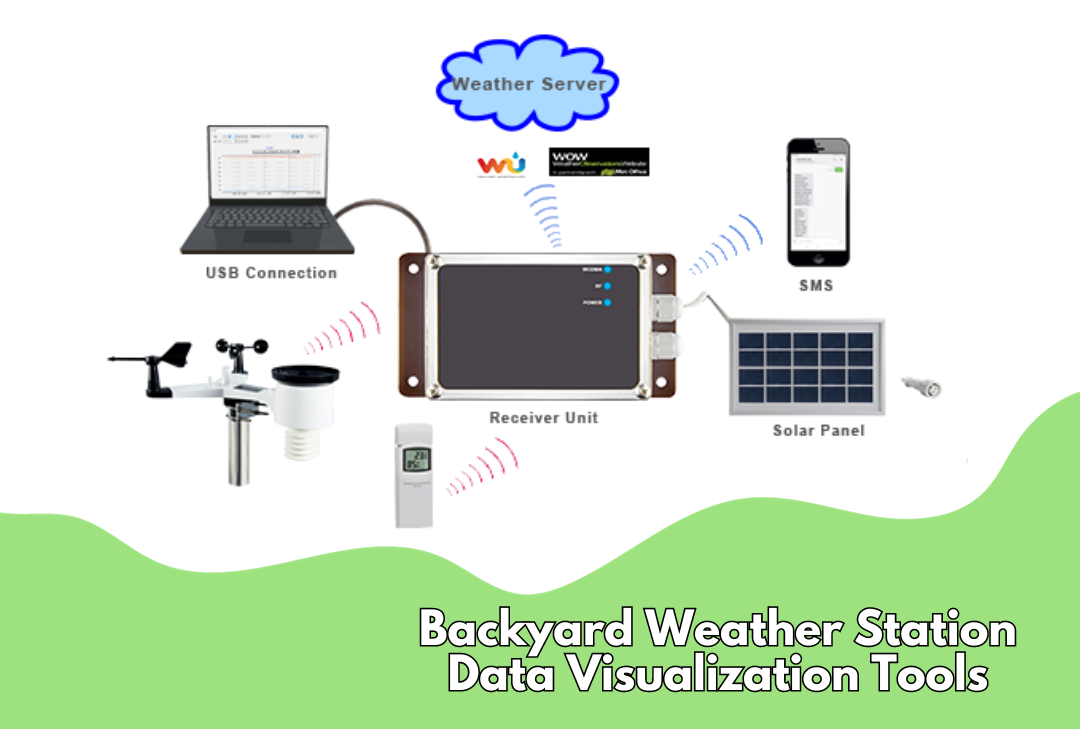
Sources of Weather Data
You typically obtain weather data from two main sources: in-situ measurements and remote sensing. Your backyard weather station collects data directly from the environment. Alternatively, satellite imagery and radar systems offer large-scale data essential for comprehensive weather analysis and forecasting.
Importance of Accurate Data
The accuracy of weather data is non-negotiable, as it ensures reliability in weather forecasting and research. Accurate data helps to interpret and predict serious weather events, thus safeguarding property and lives. Precise tools and rigorous quality control measures are vital to ensure data integrity.
Weather Station Setup
Setting up a personal weather station involves specific steps to ensure accurate data collection. Your setup process will revolve around locating the right spot, meticulous sensor installation, and regular maintenance.

Choosing a Location
- Avoid Obstructions – Your weather station should have a clear flow of air around it. Keep it away from buildings, trees, and other structures to prevent data distortion.
- Height Considerations – For wind measurements, a height of approximately 33 feet above ground level is recommended to minimize surface-level effects.
Installation of Sensors
- Secure Mounting – Ensure all sensors are securely mounted to avoid damage and data inaccuracies from loose fittings.
- Orientation – Position your rain gauge and anemometer facing north for consistent, standardized measurements.
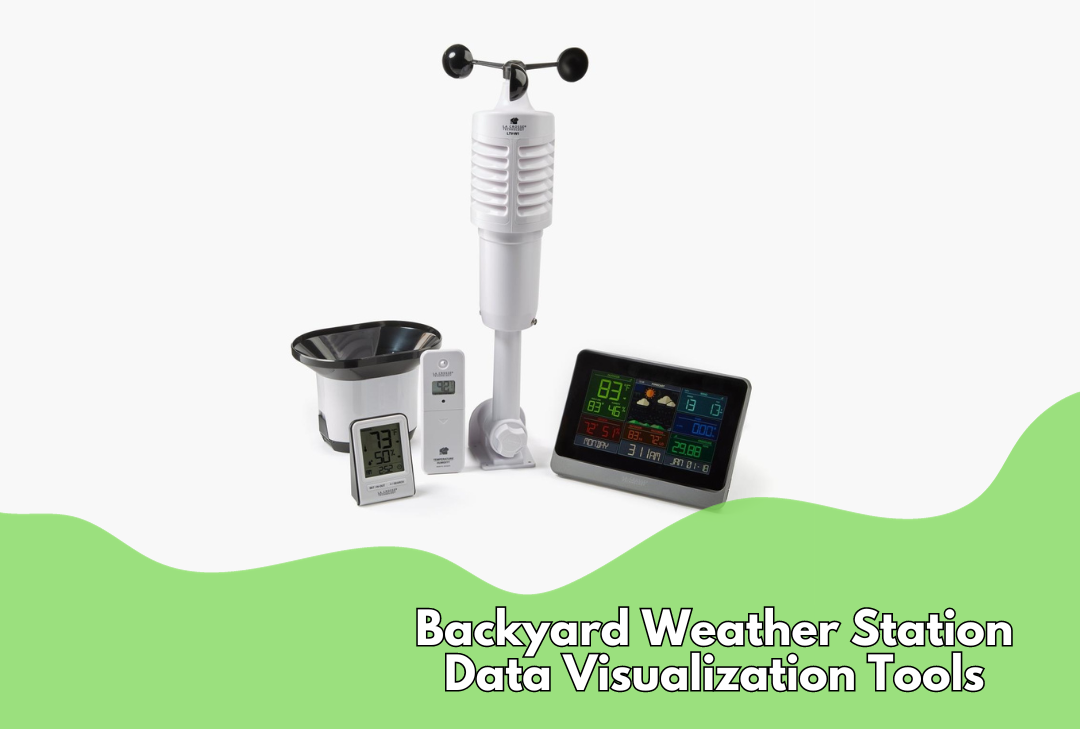
Backyard Weather Station Data Visualization Tools
- Clean Regularly – Inspect and clean sensors every few months to remove debris and ensure accurate readings.
- Calibration Checks – Regularly compare your station’s data with official readings and adjust if you notice significant discrepancies.
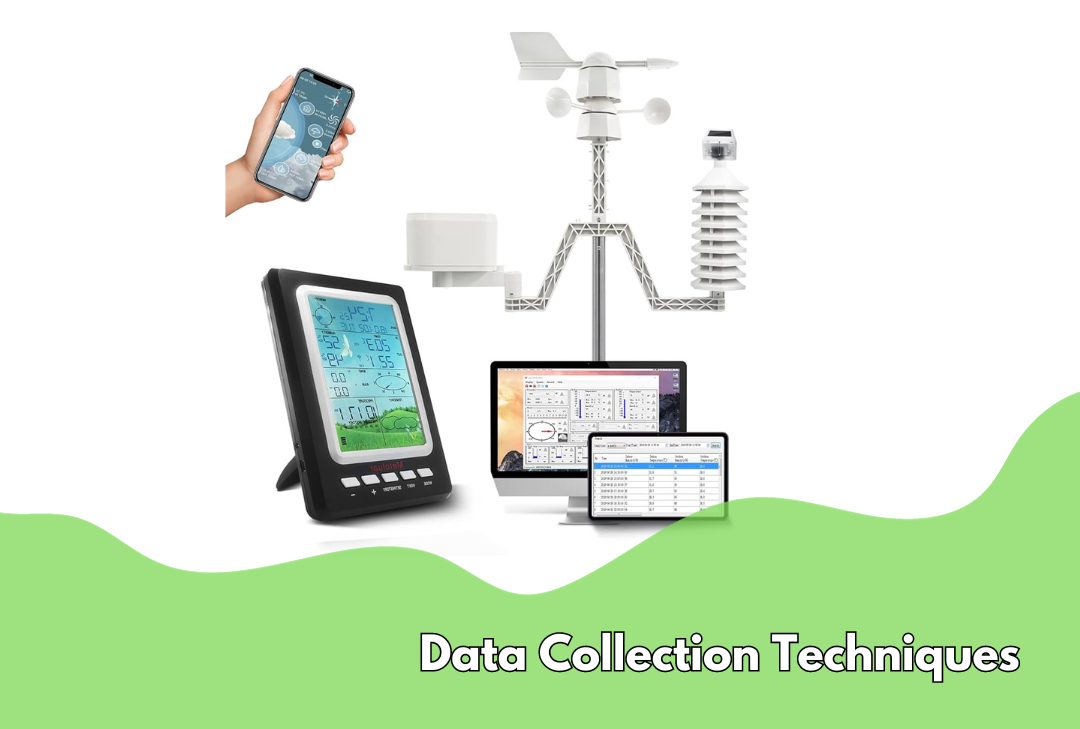
Data Collection Techniques
Weather stations employ a variety of methods to gather data, each playing a pivotal role in ensuring comprehensive and reliable weather monitoring.
Automated Data Logging
Automated data logging is a critical component of modern weather stations. Instruments like temperature sensors and rainfall gauges collect data around the clock without your direct involvement. These devices convert environmental parameters into digital data, which a data logger records at preset intervals. This approach saves time and increases the data’s granularity and reliability.
Manual Data Entry
In contrast, manual data entry involves the direct input of observations into databases. You might measure the daily rainfall and enter these values manually. Although more labor-intensive, this method is still used in circumstances where automatic logging isn’t available or needed as a supplement to validate automated systems.
Data Accuracy and Frequency
Data accuracy and your station’s observation frequency are paramount. While weather stations offer varying intervals of data collection from every few minutes to hourly, it’s essential to ensure that sensors are calibrated correctly for precise measurements. Regular maintenance serves to protect the integrity of your weather data, ensuring that your analyses and predictions are based on solid and dependable data sets.
Backyard Weather Station
Data Visualization Tools
In this section, you’ll understand how backyard weather station data can be transformed into meaningful insights through the art and science of data visualization.
Data Representation
Your weather station collects a variety of data points, such as temperature, humidity, and wind speed. Representing this data effectively is crucial to uncover patterns and make informed decisions. Tables can be used for detailed numerical views, while graphs and charts, like line graphs for temperature changes and bar charts for rainfall, are excellent for spotting trends and forecasting.
Choosing Visualization Tools
Select a visualization tool that caters to your specific requirements, balancing complexity and ease of use. For instance, NOAA’s Weather and Climate Toolkit is robust for serious enthusiasts and professionals who need a sophisticated analysis. Tools should support various data types and provide options for customization and analysis without overwhelming you with unnecessary features.
Custom vs. Pre-built Solutions
Decide between custom and pre-built solutions based on your skill level and the granularity of data you wish to explore. Custom solutions offer flexibility and are tailored to your exact needs but require more technical skill. Pre-built solutions, on the other hand, are user-friendly and often sufficient for general purposes, providing a good balance between functionality and convenience.
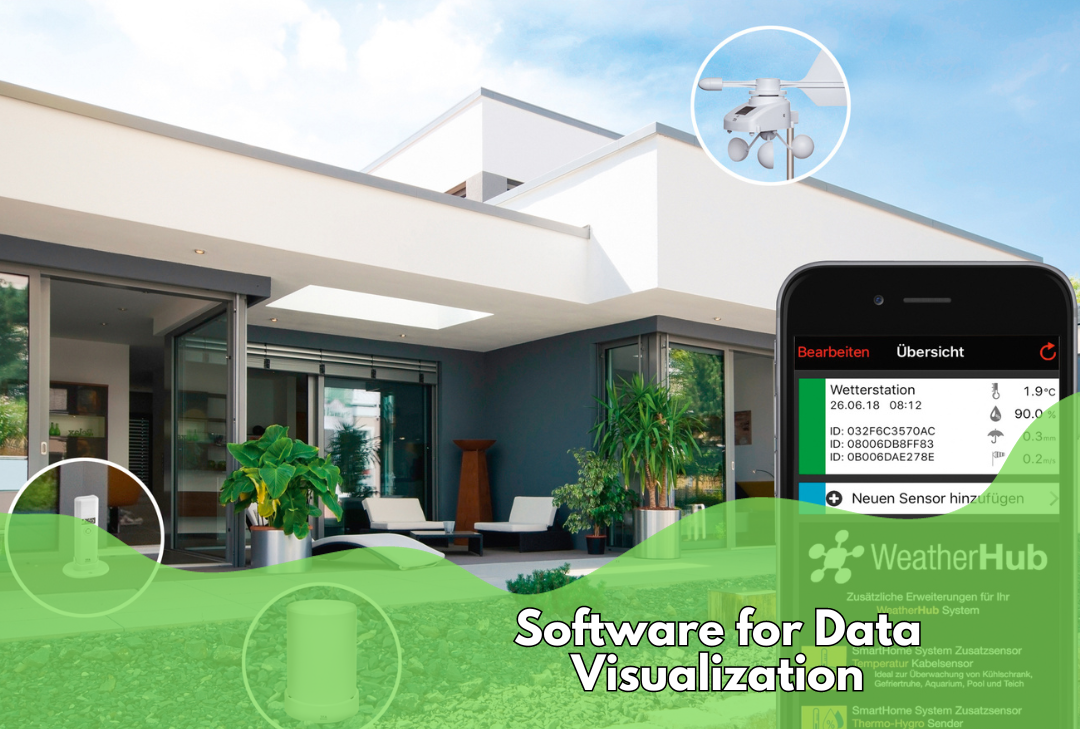
Software for Data Visualization
Selecting the right software is crucial for effectively visualizing data from your backyard weather station. Options range across desktop applications, online platforms, and mobile apps, each offering unique tools to process and display weather data.
Desktop Applications
Desktop applications often provide robust features for in-depth weather analysis. For instance, NOAA’s Weather and Climate Toolkit offers a comprehensive visualization and data export tool suite, letting you closely examine weather elements like radar and satellite data. These applications frequently support various data formats, permitting a seamless blend of data types for analysis.
Online Platforms
Online platforms are convenient for accessing and sharing weather data visualization. AmbientWeather.net, a cloud-based service, enables you to access your weather data from any device with a web browser. These platforms are typically user-friendly, ensuring you can monitor and share your weather data without a steep learning curve.
Mobile Apps
Mobile apps provide the advantage of accessing and visualizing your weather station’s data on the go. They are designed for easy navigation on smaller screens and often offer real-time weather data alerts and updates. Applications vary in compatibility. Some are explicitly tailored for certain weather station models, while others are more universal.
Integrating Data with Visualization Tools
Integrating data with backyard weather station data visualization tools is crucial in understanding and predicting the weather through your backyard weather station. You need to display data in an easy-to-digest manner for accurate analysis.

Data Import Methods
Your weather station collects various types of atmospheric data, such as temperature, humidity, wind speed, and precipitation. To visualize this data, you need first to import it into your chosen software. Methods include manual upload of data files or automated retrieval where the software syncs with your station at scheduled intervals. For instance, platforms like GIS software by Esri allow you to map and understand this data spatially through different import techniques.
Real-time Data Streaming
For timely and actionable insights, real-time data streaming is essential. This process involves the continuous transmission of data as it is collected. Visualization tools that support real-time streaming will update your dashboards and maps instantaneously. An example is NOAA’s Weather and Climate Toolkit, which enables visualization and data export in real-time for various weather parameters.
Cloud-Based Data Services
Leveraging cloud services offers you the ability to store vast amounts of data without worrying about local storage limitations. Cloud-based platforms can easily scale up with your data needs and often provide sophisticated tools for deeper analysis and visualization. One can access and visualize this data through different services, incorporating it into platforms supporting cloud-based integration and enhancing weather data analysis and modeling capabilities.
Creating Custom Visualizations
Creating custom visualizations for your backyard weather station data allows you to tailor the information to your specific needs and preferences. Understanding the design principles, interactivity features, and user experience considerations will enhance your ability to display and interpret your weather data effectively.
Design Principles
When designing your custom weather visualizations, focus on clarity and simplicity. Your graphics should make it easy for the viewer to identify key patterns and insights at a glance. Use colors judiciously to differentiate between data points without overwhelming the viewer. Align your visualizations with the Visual Crossing Weather tools, enabling seamless integration of data and design.
Interactivity Features
Incorporating interactivity into your visualizations can greatly improve engagement and usability. For instance, tooltips that display exact values when you hover over data points can provide additional context. Furthermore, enabling users to filter or zoom in on data, as demonstrated by NOAA’s Weather and Climate Toolkit, can allow for a more focused analysis of specific periods or phenomena.
User Experience Considerations
Your custom visualizations should prioritize a positive user experience. They must be accessible on multiple devices, load efficiently, and present data in an intuitive manner. Take inspiration from platforms like ThingSpeak Weather Station, which emphasizes a balance between aesthetic appeal and practical utility. Remember to design with the end-user in mind, accounting for their level of expertise and the tasks they will perform with the data.
Analyzing Weather Patterns
When you leverage weather station data visualizations, you gain the ability to discern trends, compare historical weather events, and track extreme conditions with precision.
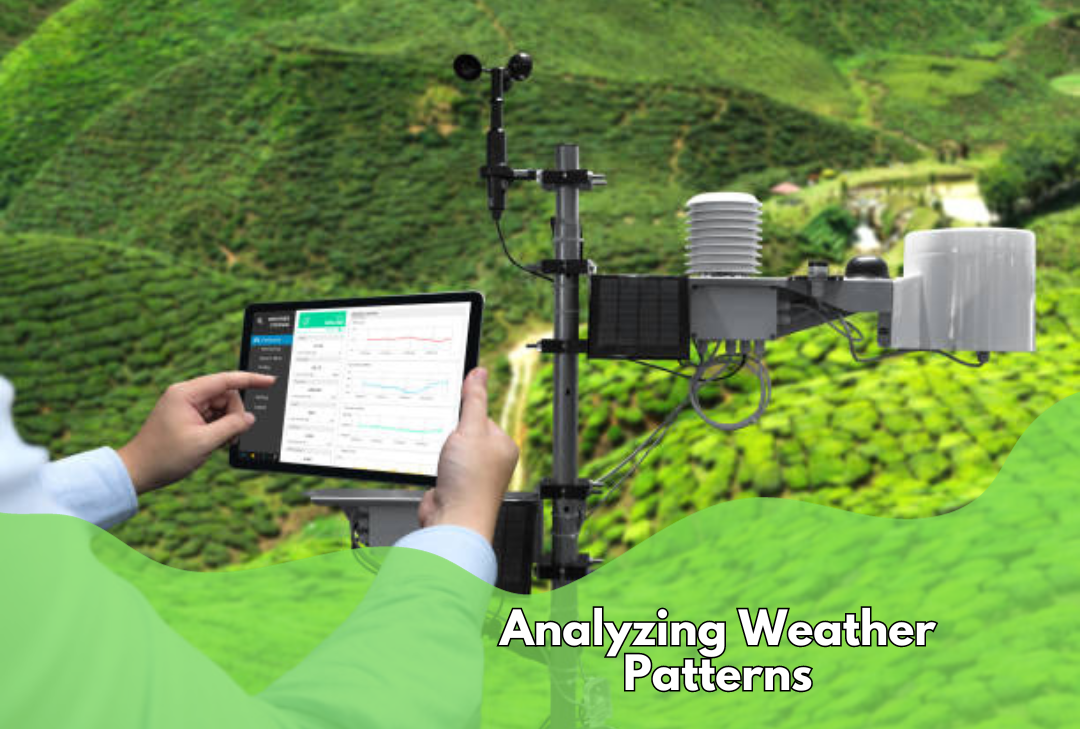
Trend Analysis
In Trend Analysis, you examine weather data over a specified timeframe to identify patterns and anomalies. For instance, when using tools like Weatherment, you can analyze temperature fluctuations to predict future weather conditions. Graphs and charts are effective for displaying these trends, allowing for a visual assessment of data such as precipitation levels or wind speed consistency over the course of months or years.
Historical Data Comparison
Comparing Historical Data is vital for understanding how weather patterns evolve. By overlaying past and present data, you can determine shifts in climate or the impact of urban development on local weather. The NOAA’s Weather and Climate Toolkit provides an expansive archive, enabling you to compare current weather data against historical records to assess long-term changes and variances.
Extreme Weather Event Tracking
Extreme Weather Event Tracking involves monitoring and analyzing data related to severe weather occurrences. You can track the path of hurricanes, the intensity of heat waves, or the accumulation of snowfall, which is crucial for preparedness and response planning. Visualization tools offer layered mapping, showing the geographical spread and impact of such events, thereby providing a comprehensive view of the situation unfolding.
Sharing Weather Data
Weather stations in your backyard not only support your personal interest in meteorology but also allow for a significant contribution to a broader audience. By sharing your weather data, you can help improve local forecasts, contribute to scientific research, and engage with other weather enthusiasts.
Data Sharing Platforms
You can make your weather station data available to others through a variety of data-sharing platforms. For example, making your station “public” on WeatherLink.com ensures it appears on the WeatherLink map. Alternatively, platforms like WeatherFlow allow you to toggle public data sharing through website settings or their mobile app.
Privacy and Security
While sharing data, privacy and security should not be overlooked. Ensure that the platform you use has options to anonymize your location if you prefer not to share your exact address. Knowing who can access your data and how it might be used is also important.
Community Engagement
Sharing weather data fosters community engagement. It allows you to collaborate with fellow enthusiasts and professionals who can offer insights or benefit from your data. Educational institutions and hobbyist groups often rely on data from personal weather stations to supplement their own research and learning activities.
Sharing data can be more than just an individual pursuit. It’s an opportunity to be part of the larger meteorological community.
Improving Weather Predictions
Enhancing weather predictions through backyard weather stations involves leveraging data-rich technologies and smart analytical strategies.

Machine Learning Applications
Machine learning is a powerful tool for analyzing complex weather data. By training algorithms with historical weather patterns, you can unlock predictive capabilities that continually improve as more data is fed into the system. For instance, the integration of GIS with machine learning, as seen on Esri, facilitates more advanced weather data visualization and prediction.
Predictive Analytics
Predictive analytics enable you to foresee weather changes more accurately. Using various models, which can include statistical methods, you can extract meaningful information from large datasets to predict future weather conditions. Tools and software, such as those discussed on LinkedIn, are instrumental in improving forecasting accuracy, by determining the likelihood of specific weather events.
Accuracy Improvement Techniques
To enhance the accuracy of your weather predictions, you can apply multiple techniques:
- Data Quality Enhancement – Ensuring the data from your backyard weather station is free from anomalies and inconsistencies.
- Algorithm Optimization – Fine-tuning predictive models to better capture the nuances of weather patterns.
- Continuous Validation – Regularly comparing predictions against actual outcomes to refine algorithms.
Embracing these methods, as exemplified by the visual big data systems mentioned in Springer’s article, helps in handling the vast dimensionality and variability of meteorological data.
Wrapping It Up
Now you know how easy it is to bring weather data to life right in your backyard. These backyard weather station data visualization tools simplify understanding the weather and turn it into a fun, everyday adventure. Don’t let the sky’s secrets stay hidden!
Start exploring your own weather patterns today. Are you ready to become the local weather guru? Let’s make weather-watching easy!
FAQs
What software is recommended for creating a weather dashboard using personal weather station data?
Consider using visualization tools like Weather Display or Cumulus to create a weather dashboard with your data. These programs support a variety of weather station models and offer customizable interfaces for monitoring your climate data.
How can I integrate my personal weather station with a weather visualization network?
To integrate your station with a network, Weather Underground is a popular choice. By signing up and configuring your device to share data, you become part of a global network, contributing to shared weather insights.
Which instruments are essential for a home-based weather station to provide comprehensive data?
A well-equipped weather station should include instruments like temperature and humidity sensors, a barometer for pressure, an anemometer for wind speed and direction, and a rain gauge. These instruments are critical for comprehensive weather monitoring.
What are the best practices for setting up a Grafana dashboard for weather monitoring?
When setting up a Grafana dashboard, ensure accurate data sources are linked, set appropriate refresh intervals, and create clear visualizations by choosing graphs and gauges that match the type of data your instruments collect. Custom alerts can also be configured for specific weather conditions.
How do I share data from my backyard weather station with a local personal weather station network?
To share your data, locate a network like CWOP (Citizen Weather Observer Program) or PWSweather, register your station, and follow the provided instructions to set up data transmission, often involving FTP settings or specific software that uploads data directly to their platform.
Learn More About Your Backyard Weather Station!
Join our online community, and let’s monitor the weather together! Discover the precision, insights, and fascination that come with owning a backyard weather station. Embrace the excitement and discovery that awaits you in your own backyard.
Follow us on Facebook, Instagram, and Twitter, and let’s share our weather observations and experiences!
Facebook: https://www.facebook.com/BackYardPatioLife/
Instagram: http://instagram.com/backyardpatio_life
Twitter: https://twitter.com/happybackyard
Happy Weather Watching!